Dr. Dave Thissen and more than ten graduate students involved with his research group over the past decade have collaborated with colleagues in the UNC Schools of Medicine and Public Health, and at other institutions, on the interdisciplinary NIH-initiated Patient-Reported Outcomes Measurement Information System® (PROMIS®). During the first few of those years the UNC group used contemporary test theory to develop pediatric patient-reported outcome (PRO) measures of such constructs as depressive symptoms, pain interference, fatigue, and mobility. More recently the UNC team’s collaboration has expanded to include researchers at other sites specializing in specific pediatric health disorders, to collect and analyze data that use the PROMIS measures as the response variables in treatment outcome studies.
Such uses of health outcome measures invite the question “how much change is a change?” between a pre-test score and a post-test score. Like most psychological measures, PROMIS scores are on an arbitrary scale in points that refer to fractions of a standard deviation in a reference population; the PROMIS scores were defined to have an average of 50 and a standard deviation of 10. That definition of the score scale is useful for statistical analyses but not meaningful to the users of the scores: medical researches, their pediatric patients and their parents.
To provide a meaningful frame of reference for research on change, investigators of health-related quality of life have sought to define the minimally important difference (MID) as the “smallest difference in score that patients perceive as important, and which would lead the clinician to consider a change in the patient’s management.” There are procedures to establish MID values for measures for which there are recognized standards of severity that are distinct from the scores on the questionnaires. But for the more psychological constructs involved in the pediatric PROMIS measures, it is difficult to find such standards. To estimate a MID value for our scales, Dr. Thissen’s team drew on ideas that originated with L.L. Thurstone’s 1927 development of psychological scaling, as well as modern test theory, to create the scale-judgment method.
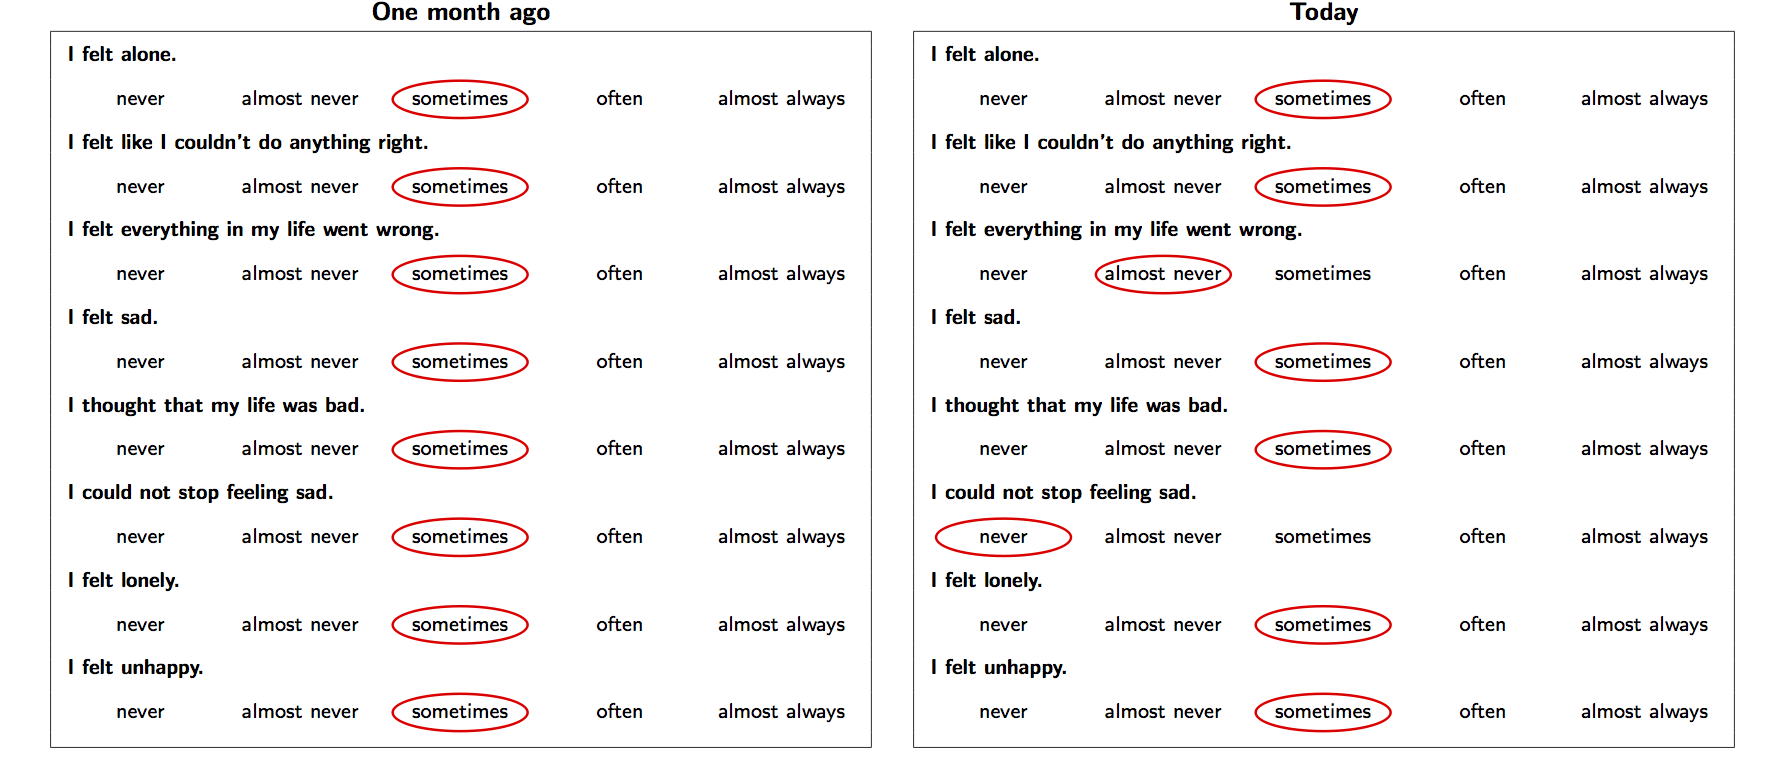
In the scale-judgment method, panels of judges evaluate pairs of completed PRO questionnaires that may be labeled “One month ago” and “Today” (or any other variant of “before” and “after). Each judge indicates whether the amount of change between the responses on the two questionnaires represents a meaningful difference. Each stimulus pair also has a difference score, but those values are not revealed to the judges.
 The first study on the scale judgment method involved three groups of judges: 78 adolescents, 85 parents, and 83 clinicians. Six pairs of completed questionnaires were created for each of four domains measured by the PROMIS pediatric scales: Depressive Symptoms, Pain Interference, Fatigue, and Mobility. Within each set of six pairs, three were associated with improving scores, and three with worsening scores. The example on this page is of one of the 24 stimulus pairs; this pair indicates an improvement (reduction of depressive symptoms) of 3.2 points.
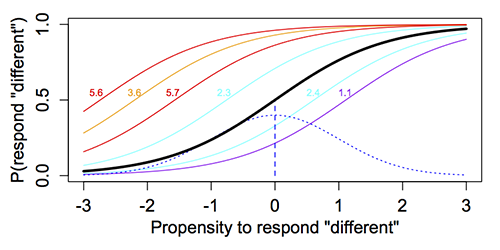
Statistical analysis of the judges’ responses proceeded as if the stimulus pairs were 24 items on a test measuring the judges’ propensity to say that the scores differed, because there are individual differences among the judges’ inclination to say that. Some people think small differences in the responses are meaningful; others require a larger score difference before saying there has been change. The item response theory (IRT) model used to analyze the data can be illustrated graphically: On the x-axis is an unobserved variable that can be called the “propensity to respond ‘different’”; the y-axis is the probability of responding “different.”

The colored S-shaped curves in the graphic represent the probability of responding ‘different’” as a function of the “propensity to respond ‘different’” for six of the stimulus pairs, associated with score differences between 1.1 and 5.7 points. Almost everyone says the stimulus pair associated with the leftmost red curve for a difference of 5.6 points represents a meaningful difference, but only those most likely to say pairs differ respond “different” for the right most purple curve associated with a difference of only 1.1 points.
The blue dashed line shows the population distribution for the “propensity to respond ‘different’.” The vertical dashed line is at the mean, and an inferred trace line is drawn as a thicker black line with its 50-50 point (b) at the mean. The (hypothetical) value of the scale score difference associated with the 50-50 point of that thicker trace line, computed by interpolation of the relationship between the b parameters and scale score differences for the existing stimuli, is the estimate of the MID. That would be a (hypothetical) pair that the average judge would have a 50% chance of calling “different.”
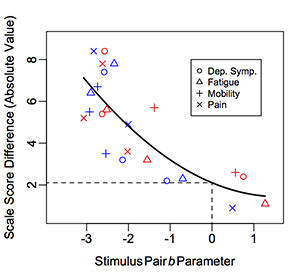
 When the scale score differences are plotted against the b parameters (thresholds) for the 24 stimulus pairs, a smooth curve can be added. The graphic uses color for positive (blue) vs. negative (red) change, and plotting symbols to identify the domains for each pair. Those variables did not affect the judgments, so one smooth curve was used for all 24 points. To compute the estimate of the MID, the value of the scale score difference was located that corresponds to a stimulus pair b parameter value of 0. This is the scale score difference for a (hypothetical) pair of filled-in questionnaires that would have a b parameter equal to the mean of the respondents’ distribution; that is, that an average respondent would say “different” with a probability of 50% for a pair of pre- and post-test questionnaires with scores differing by that many points. The MID estimate for clinicians is shown in the graphic: MID = 2.1, s.e. 0.6. So the PROMIS pediatric measure’s MID is a little over 2 points, with a standard error of a little over a half point, for the average clinician. For the average adolescent, or the average parent, MID is a little higher.
 Dr. Thissen is a Professor in the Quantitative Psychology Program within the Department of Psychology and Neuroscience at UNC Chapel Hill. He develops methods to analyze data obtained with psychological tests and questionnaires, to administer questions in creative ways, and to compute test scores. The goal is always to obtain the best possible psychological measurement while imposing minimal burden on the respondents. Learn about Dr. Thissen’s work online.

